What Are The Numbers Behind POS Research?
Statistics Worth Knowing To Support Your Point of Sale Project
Point of Purchase is an important part of the shopping experience and proper application of it increases sales and improves customer satisfaction. However, much of the research is very dense and it can be difficult locating the specific information and raw numbers you need to gain insights. Here are important statistics concerning POP along with links to associated text and research material.
Important Point of Purchase Stats You Need to Know
Marketing Size And Spending
Retail sales in the United States totalled 5.3 trillion dollars in 2015, the UK showed totals of £358 billion in 2016, and the global market reflecting 20.8 trillion dollars in earnings during the 2015 calendar year. Survey results show that companies with $250 – $500 million in yearly revenue will spend 10 percent of these earnings on marketing expenses with larger (yearly revenue figures greater than 5 billion) companies will spend 13 percent of their yearly revenue with the UK following these trends.
How Effective Is POP Marketing?

Research from the Point of Purchase Institute shows that POP marketing greatly affects customer response. For example, by properly advertising a price reduction customer response increased by a factor of 6 times as much than without. Research also showed that point of sale marketing increased overall product purchases even without an ongoing sale and when combined with a sale further increase purchase rates.
Customers Tend Towards Impulse Purchases
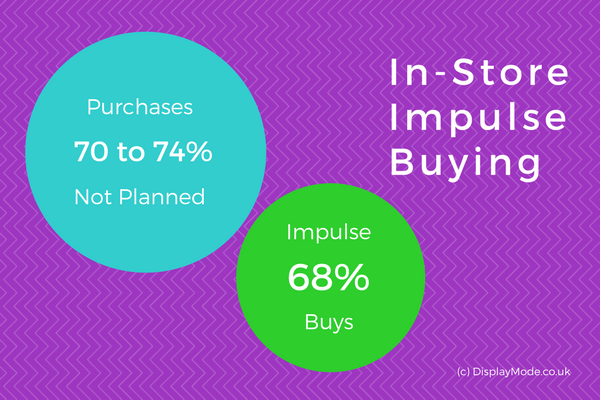
It is important to note that in ‘mass merchandise’ stores 74% (see page 2) of all customer purchases and not planned in advance and are made in the store itself. This also extends to the grocery industry as well with 70% of purchase decisions being made in store and 68% of these in store purchases being impulse buys.
The Small Time Window of Customer Behaviour
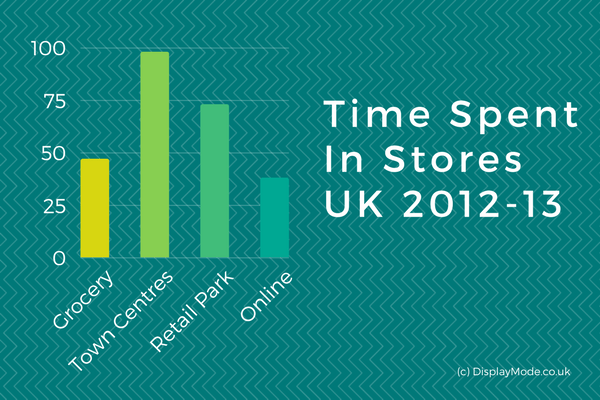
Customers notice packaging before they do price often 4.7 to 6 seconds earlier depending on the product. Also, time spent in a store is relatively short with grocery stores averaging 41 minutes and 84 minutes in mall settings with two stores visited on average in the United States. The UK statistics also reflect similar behaviour with grocery stores averaging 47 minutes, retail parks averaging 73 minutes, and town centres averaging 98 minutes.
Further Insights Gained From Research
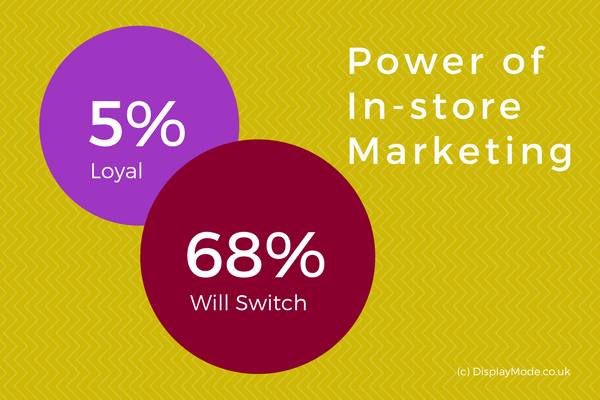
A common theme across all reports is that customers are responsive to in-store marketing and 68% percent (see page 32) of customers will switch to a different product or brand and only 5% have ‘brand loyalty’.
Source and Further Research Materials
For further insight, some of the above figures are taken from the following reports. Each covers various aspects of Point of Purchase, customer behaviour, in-store marketing, sales strategies, and so on.
- Shopper Marketing: Capturing a Shopper’s Mind, Heart, and Wallet: presented by the GMA (Grocery Manufacturers Association) their findings related to consumer behaviour in grocery stores and related industry changes in marketing. It can be read here.
- Measuring the Value of Point-of-Purchase Marketing with Commercial Eye-Tracking Data: presented by the Wharton Business School at the University of Pennsylvania this study focused on the visual aspect of in-store sales and how it drives consumer behaviour. It can be read here.
- Sales Effects of In-Store Advertising: written by marketing professors Arch G. Woodside and Gerald L. Waddle this experiment measured customer response (in terms of sale volume) to POP marketing in general and the associated effect of product sales. It can be read here.
Use of Materials on this Page
Please feel free to use the graphics on this page. We only ask that you link back to us to credit source.
[fl_builder_insert_layout id=2177]